
Yesterday I posted an article (https://potatoit.wordpress.com/2010/10/22/exploring-the-smart-office-visual-tree-%E2%80%93-figuring-out-the-field-names/) on exploring the Visual Tree and how I was encountering and OutOfMemory Exception. I must admit it kinda bugged me all through the night, so much so that instead of my desire to inspect what Smart Office does network wise with Wireshark I spent today investigating.
The traversal of the Visual Tree and outputting some very basic data shouldn’t use much in the way of memory at all, so I wondered if there was something really quirky that I had overlooked in the way jscript handles its garbage collection. My friend google didn’t really show up anything that appeared to be applicable, so it was time to dust off some low level debugging skills.
I’ll qualify this and say that my lower level debugging skills when I don’t have MY source-code amounts to what I have read on Tess Ferrandez blog http://blogs.msdn.com/b/tess/ and of-course Microsoft had their msdn blogs down for maintenance when I was looking up the relevant articles that I needed to load sos.dll (which allows you to debug managed code).
So, I ran Smart Office, loaded Visual Studio 2010 and attached Visual Studio 2010 to the LawsonClient.exe process. I then loaded up BUS100, then ran mforms://jscript and loaded up my little script (see the previously mentioned post).
As per before, about 1.3gig of ram was consumed by LawsonClient.exe after the script had finished, so I paused Smart Office in Visual Studio 2010 and took a crash dump. (I did this as I was struggling to get sos.dll loaded and was missing some of the settings in Visual Studio).
I then resumed Smart Office and closed it and closed Visual Studio 2010. Finally I went out and used Visual Studio to load the crash dump. I was now able to load sos.dll which would allow me to inspect managed objects.
Now I had a sneaking suspicion that this could be related to an issue I noticed a while ago when I was cutting some code which would provide frequent status updates to a textbox. There were literally millions of updates – as it turns out, the TextBox in WPF by default will remember every change and subsequent undo level – so it could have undone hundreds of thousands if not millions of changes, not very handy for a status update, but a lesson learned.
But I digress. One of the really handy commands with sos.dll is the !dumpheap –stat command, this will dump out a summary of object types, the number of those objects and the total amount of RAM consumed by those objects. I dumped these to Excel so I could take a closer look naively expecting to have to do a lot of digging.
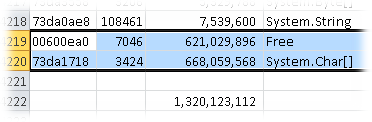
Ok, 621meg of RAM consumed by an object called “Free”, how interesting, I wonder what that is.
A little googling revealed this article http://msdn.microsoft.com/en-us/magazine/cc534993.aspx
The relevant section being “Since the LOH is not compacted, sometimes people suspect that the LOH is a source of fragmentation. You really need to first clarify what fragmentation means. There’s fragmentation of the managed heap, which is indicated by the amount of free space between managed objects (in other words, what you see when you do !dumpheap –type Free in SoS);”
Interesting indeed – so potential fragmentation. Ok, now the second line, the almost 670meg of character array objects – wow! Interestingly there is only 3424 of these objects, but they are consuming a huge amount of RAM.
Sos.dll can also dump all of the objects of a certain type and the memory addresses – handily you can then take a look at the memory locations themselves to see what is up. I wanted to take a look at the System.Char[] objects so the command is !dumpheap –type System.Char[]. Again I dumped some of these in to Excel.
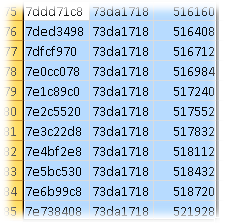
The thing of interest in that the size, the third column keeps on incrementing – which kinda smacks of a similar problem that I saw with the WPF TextBox in another project – as a new item is added, the old is removed but remains in RAM.
With that in mind, I decided to test to see if it was a similar issue and I commented out all of the debug.WriteLine() commands – so the code would still iterate through the entire tree, but wouldn’t print out anything to the debug console. And what do you know, not only did the script not crash, but it also didn’t eat silly amounts of RAM.

A little more investigation shows that the debug object is an object from within MForms, specifically MForms.ScriptDebugConsole
So, it looks like something that I need to raise with CASE to see if it is a bug with Smart Office. In the meantime, I’ll look at converting the code so it outputs to a text file or perhaps use the StringBuilder object to combine the information and output it in one hit.
Update 20101122 Lawson have informed me that LSO 9.1.2.3 resolves this issue, I haven’t checked it personally but…
